An Academic Writing Task 1 line graph tracks how one or more values change over a time period and asks you to report the main trends in at least 150 words in about 20 minutes. You’ll only meet it in IELTS Academic, because General Training Task 1 is a letter. The examiner marks Task Achievement on whether your overview states the main trends clearly, not on how many numbers you copy out.
This guide runs through question types, recurring topics, a step-by-step method, the four-paragraph structure, the overview, trend language and tenses. Then comes a band 9 sample, the same graph rewritten at band 7, common mistakes, practice and scoring. Full word lists and tense rules sit on their own linked pages.
What Is an IELTS Writing Task 1 Line Graph?
An IELTS Writing Task 1 line graph is a visual in the Academic Writing test that plots one or more variables against time, which you summarize by selecting and reporting the main features. The x-axis carries the time period and the y-axis carries the values.
It appears only in the Academic module, as the first of two tasks in IELTS Writing Task 1, and needs at least 150 words in about 20 minutes. The prompt ends with this instruction: “Summarise the information by selecting and reporting the main features, and make comparisons where relevant.”
A line graph shows change over time through trends, peaks and fluctuations. A bar chart usually compares categories. A pie chart shows proportions of a whole. A table gives exact figures with no visual trend.
What Line Graph Questions Does IELTS Writing Task 1 Ask?
Line graph questions differ mainly in their time frame and in how many lines they show. You might get a past period, a projected future, multiple lines, or a line graph paired with another chart. Each of the five types demands one change in your answer, usually to the tense or the grouping of lines.
- Past-period line graph: every year on the axis is over, so the whole report stays in past tenses, mostly the past simple.
- Past-to-projected-future line graph: real data runs into forecasts, so you switch to future forms such as “is expected to” for the projected years.
- Single-line graph: with one variable on a single line, the overview names the overall direction plus the highest and lowest points.
- Multiple-line graph (three to five lines): group the multiple lines by shared behavior, because describing each one in legend order hides the comparison.
- Line graph combined with another chart: describe each visual briefly, then link both in an overview that says what they show together.
The past-to-future type carries the tense trap. A typical question prompt, written by OneIELTS with invented figures, reads: “The graph below shows the number of electric cars sold in one country from 2010 to 2025, with forecasts to 2040.”
What Line Graph Topics Come Up in IELTS Writing Task 1?
Line graph prompts reuse a small set of themes that naturally change over time: population, energy, the environment, the economy, transport, tourism and consumer habits. Practicing by theme covers most graphs you’ll meet. Six theme families account for nearly every prompt, each shown here with one original practice prompt built on invented data.
| Theme | Typical variables plotted | Typical time span | One original practice prompt |
|---|---|---|---|
| Population and demographics | Population by age group, birth rates and life expectancy across one or several countries | Fifty to one hundred years, often in ten-year steps | The graph shows the share of people aged over 65 in three countries, 1960 to 2020. |
| Energy | Energy consumption by fuel type such as coal, gas, nuclear and renewables, often with projections | Thirty to fifty years, frequently ending in a forecast period | The graph shows household energy consumption from four fuels in one country, 1990 to 2040. |
| Environment | CO2 emissions per person, the share of waste recycled, or daily water use per household | Twenty to forty years, usually measured once a year | The graph shows CO2 emissions per person in four countries between 1985 and 2025. |
| Economy and work | Unemployment rate, average income or the value of exports for one or more countries | Ten to thirty years, often shown month by month or yearly | The graph shows the unemployment rate for men and women in one city, 2000 to 2024. |
| Transport and travel | Car ownership, passengers by mode, or international tourist arrivals at several destinations | Fifteen to forty years, with seasonal or yearly data points | The graph shows tourist arrivals at three coastal towns between 2005 and 2025. |
| Consumer habits | Spending on food types, sales of products, or the share of people using internet or phones | Ten to thirty years, typically one data point per year | The graph shows weekly spending on fast food, fruit and vegetables in one country, 1995 to 2025. |
These prompts reflect themes common in official and published practice material; none is a 2026 exam question. If you’re searching for a 2026 topic list, practice these themes instead, because the line graph format itself hasn’t changed. You’ll find more Task 1 graph topics with model answers on the linked page.
How Do You Write a Line Graph in IELTS?
Spend the first three to four minutes reading the graph before you write. Identify the axes and time span, find the overall trends and the extremes, and group the lines. Then write the introduction, overview and two body paragraphs, and keep two minutes to check. Seven steps take you from a blank page to a finished report.
- Read the title, axes, units and time span: note what is measured, in which units, and the years covered.
- Find the overall direction of each line: decide whether it rose, fell or stayed level, and spot the biggest change.
- Mark the highest point, lowest point and any crossing point: these extremes become evidence for your overview.
- Group the lines into two sets: sort them by shared behavior so each body paragraph covers one set.
- Write the introduction by paraphrasing the prompt: restate what, where and when through paraphrasing of the title.
- Write the overview, then two body paragraphs: state main trends, then back each group with start, peak and end figures.
- Check tenses, figures and the 150-word minimum: confirm every number matches the graph and the tense matches each year shown.
As a guide rather than a rule, split the 20 minutes into 3 to 4 minutes of planning time, 14 to 15 minutes of writing and 2 minutes of checking.
How Should You Structure an IELTS Line Graph Report?
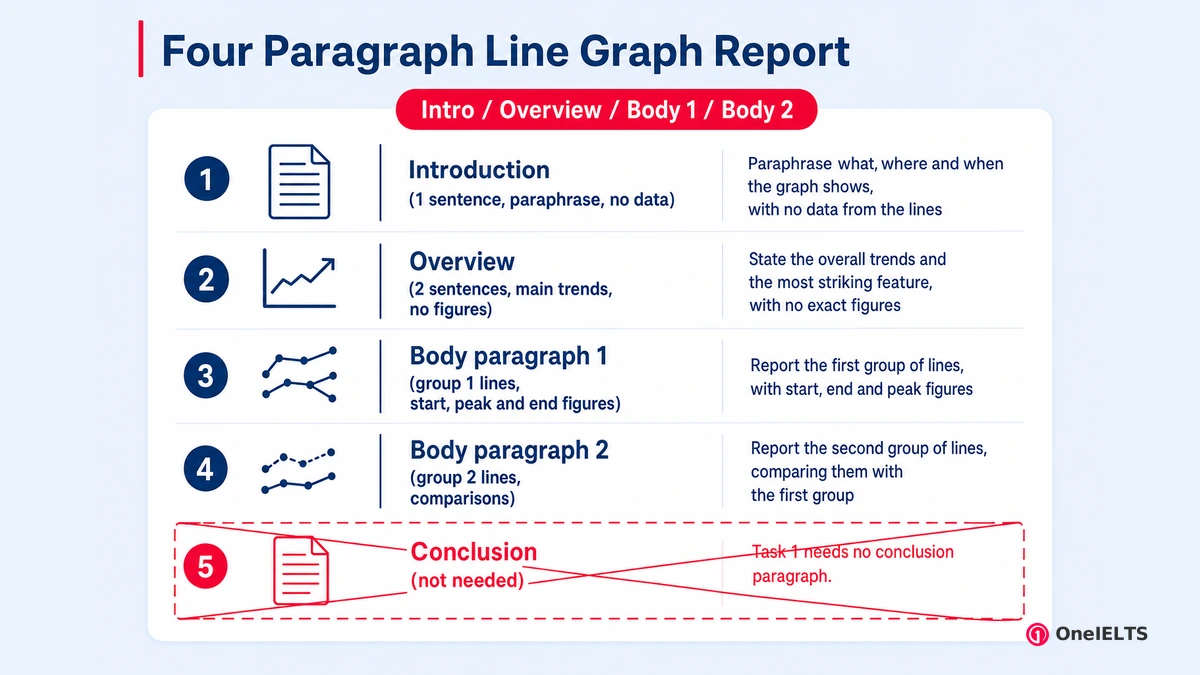
Use four paragraphs: a one-sentence introduction, a two-sentence overview, and two body paragraphs that each cover one group of lines with figures. Each paragraph has a single job, mapped out in the table.
| Paragraph | Job | Suggested length | What it must contain on a line graph |
|---|---|---|---|
| Introduction | Paraphrase what, where and when the graph shows, with no data from the lines | One sentence of roughly 25 to 35 words | The measured variable, the place and the full time period in your own words |
| Overview | State the overall trends and the most striking feature, with no exact figures | Two sentences of roughly 35 to 50 words | Overall direction of the main lines and one standout feature, such as a crossing point |
| Body paragraph 1 | Report the first group of lines, with start, end and peak figures | Three sentences of roughly 55 to 70 words | Selected figures for each line in the group and the year each figure belongs to |
| Body paragraph 2 | Report the second group of lines, comparing them with the first group | Three sentences of roughly 50 to 65 words | Key figures for the second group plus at least one comparison with the first group |
Grouping decides how strong the body paragraphs read. Split the lines by those that rise against those that fall, by the period before and after a turning point, or by larger against smaller values. Describing lines one by one in legend order is the weakest option, because it buries the comparisons. Task 1 needs no conclusion paragraph. The overview already does that job, so a closing summary adds words but earns no marks.
How Do You Write the Overview of a Line Graph?
Write two sentences that name the overall direction of the main lines and the single most noticeable feature, such as the highest line, a crossing point or a reversal, with no exact figures.
This paragraph carries more weight than any other. The May 2023 Task 1 band descriptors give band 7 to a report that “presents a clear overview” in which “main trends or differences are identified” by the writer. Band 6 drops to “A relevant overview is attempted” as its overview line. Band 5 has no overview line at all, only “The recounting of detail is mainly mechanical” as its warning.
The examples below use this page’s sample graph of electricity sources, and each one shows a different overall trend or key features worth reporting.
- Overall direction of each line or group: “Overall, coal fell steadily while renewables rose, and gas grew before falling back.”
- The line that stayed highest or lowest: “Renewables began as the lowest line but are the highest by 2025.”
- A crossing point where one line overtook another: “Renewables overtook coal in the late 2010s and gas soon after.”
- A reversal in one line: “Gas reversed direction, rising until 2015 and then declining for the rest of the period.”
- The projected trend when forecasts appear: “Renewables are expected to supply over half of all electricity by 2035.”
Examiners accept the overview straight after the introduction or at the end of the report. Put it straight after the introduction, so time pressure can’t push it off the page.
What Language Do You Use to Describe Trends in a Line Graph?
Line graphs need language for six jobs: rising, falling, staying stable, fluctuating, peaking or bottoming out, and approximating figures. Each job works in two patterns, a verb with an adverb (“rose sharply”) or an adjective with a noun (“a sharp rise”). This table gives one or two examples per job, so it teaches the pattern rather than repeating the full list.
| Job | Verb + adverb example | Adjective + noun example | Line graph sentence |
|---|---|---|---|
| Upward trend | rose sharply, climbed steadily | a sharp rise, a steady climb | Renewables climbed steadily after 2000. |
| Downward trend | fell gradually, declined steeply | a gradual fall, a steep decline | Coal declined steeply between 2010 and 2025. |
| No change | remained stable, leveled off | a plateau at 15% | Nuclear power is predicted to level off. |
| Fluctuation | fluctuated slightly, varied widely | slight fluctuations, wide variation | Sales fluctuated between 40 and 45 units. |
| Highest and lowest points | peaked at, bottomed out at | a peak of 36%, a low of 5% | Gas peaked at 36% in 2015. |
| Approximate figures | stood at roughly, reached almost | just over a third, nearly half | Renewables made up just over a third. |
Two items appear on line graphs more than on any other Task 1 visual. A crossing point needs a verb such as overtook or surpassed, as in renewables overtook coal by 2020.
Degree adverbs such as dramatically, steadily and slightly must match the size of the change, so a 2% upward trend or downward trend is never dramatic. A plateau, a peak and a fluctuation each need their own word. Examiners reward that precision under Lexical Resource. The Task 1 vocabulary page holds the full word list, and connectors cover the linking words.
Which Tenses Should You Use for an IELTS Line Graph?
The time span on the x-axis decides the tense. Use the past simple for a period that has ended, future forms for projected years, and the present perfect only when the data runs up to now. Four time spans cover nearly every line graph, each paired here with its tense.
| Time span on the graph | Tense to use | Example sentence |
|---|---|---|
| Past years only | Past simple for every change and figure | Coal fell from 52% in 1995 to 40% in 2010. |
| Past years up to the present | Present perfect for the whole period, past simple for points in it | Gas has slipped to 32% since its 2015 peak. |
| Projected years | Future forms such as “is expected to,” “is projected to” or “will” | Renewables are projected to reach 55% by 2035. |
| A point before another past point | Past perfect for a change completed by a later past year | By 2020, renewables had overtaken coal. |
Three structures let one sentence carry two changes, and each one shows Grammatical Range and Accuracy. “After rising to 36% in 2015, gas declined” uses after + -ing. “Having risen to 36%, gas then fell” uses having + past participle. “Renewables stayed at 5% until 2000, after which they climbed sharply” uses after which.
Each projection needs future forms, while the past perfect marks earlier change. The Task 1 tenses page covers every tense, and complex sentences explains clause building.
What Does a Band 9 Line Graph Sample Answer Look Like?
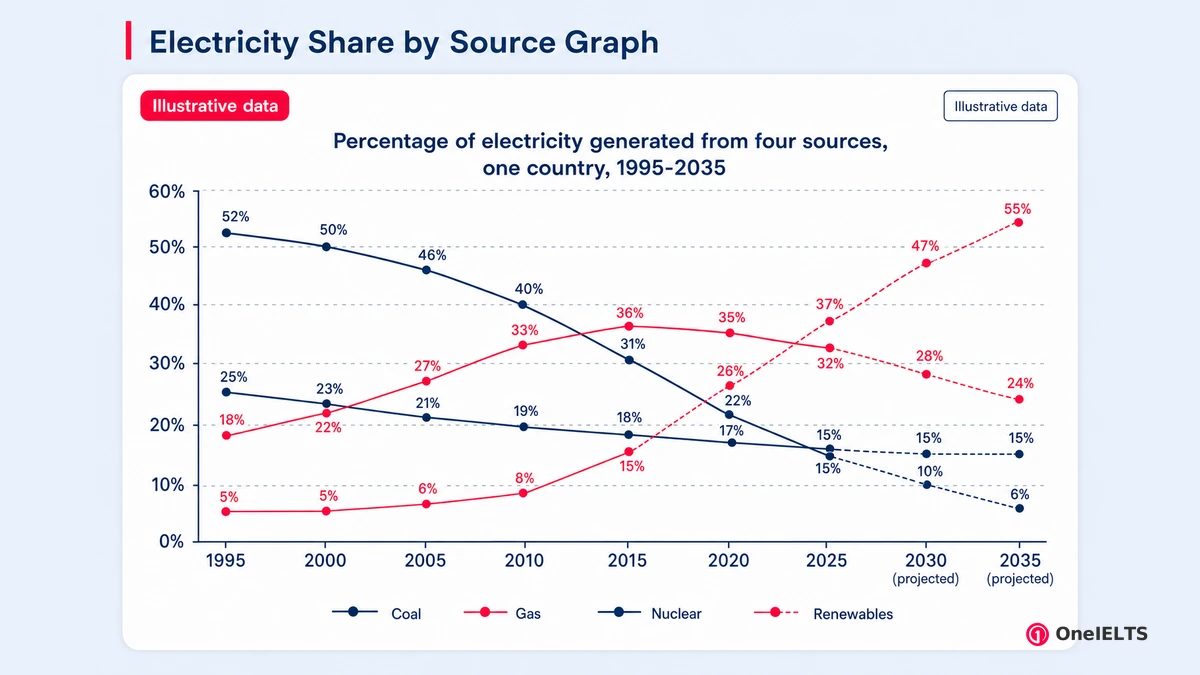
A band 9 line graph answer covers every main trend in a clear overview, supports each body paragraph with selected figures and groups the lines logically. It also uses precise, varied trend language with no errors that affect meaning. The practice prompt below is an original OneIELTS task with invented data, built for this page.
Practice prompt: The graph below shows the percentage of electricity generated from four sources in one country from 1995 to 2025, with projections to 2035. Summarize the information by selecting and reporting the main features, and make comparisons where relevant. Write at least 150 words.
| Source | 1995 | 2000 | 2005 | 2010 | 2015 | 2020 | 2025 | 2030 (projected) | 2035 (projected) |
|---|---|---|---|---|---|---|---|---|---|
| Coal | 52% | 50% | 46% | 40% | 31% | 22% | 15% | 10% | 6% |
| Gas | 18% | 22% | 27% | 33% | 36% | 35% | 32% | 28% | 24% |
| Nuclear | 25% | 23% | 21% | 19% | 18% | 17% | 16% | 15% | 15% |
| Renewables | 5% | 5% | 6% | 8% | 15% | 26% | 37% | 47% | 55% |
Model answer (band 9, 179 words):
The line graph shows how the share of a country’s electricity generated from coal, gas, nuclear power and renewable sources changed between 1995 and 2025, and how it is projected to change by 2035.
Overall, coal and renewables swapped places. Coal fell from the dominant source to a minor one, while renewables rose from the smallest share to the largest; gas rose and then fell back, whereas nuclear power declined only gently.
In 1995, coal accounted for 52% of generation, but its share declined steadily to 15% in 2025 and is forecast to drop to just 6%. Renewables, by contrast, stayed at 5% until 2000, after which they climbed sharply, overtaking coal in the late 2010s and reaching 37% in 2025. They are projected to make up 55% of the total by 2035.
Having risen from 18% to a peak of 36% in 2015, gas has since slipped to 32% and is expected to fall to 24%. Nuclear power, meanwhile, edged down from 25% to 16% over the thirty years and is predicted to level off at around 15%.
The commentary table matches each criterion to the line in the model answer that earns it.
| Criterion | What the answer does | Sentence that shows it |
|---|---|---|
| Task Achievement | Gives a clear overview of all four lines and supports it with selected, accurate figures | “Overall, coal and renewables swapped places.” |
| Coherence and Cohesion | Groups the lines into two body paragraphs and links them with precise contrast markers | “Renewables, by contrast, stayed at 5% until 2000.” |
| Lexical Resource | Varies trend verbs precisely and uses less common items such as “edged down” | “Nuclear power, meanwhile, edged down from 25% to 16%.” |
| Grammatical Range and Accuracy | Mixes past simple, present perfect and future forms with complex clauses, all error-free | “Having risen from 18% to a peak of 36% in 2015, gas has since slipped to 32%.” |
Read more band 9 Task 1 samples to see the same moves on bar charts, tables and maps.
How Is a Band 7 Line Graph Answer Different From Band 9?
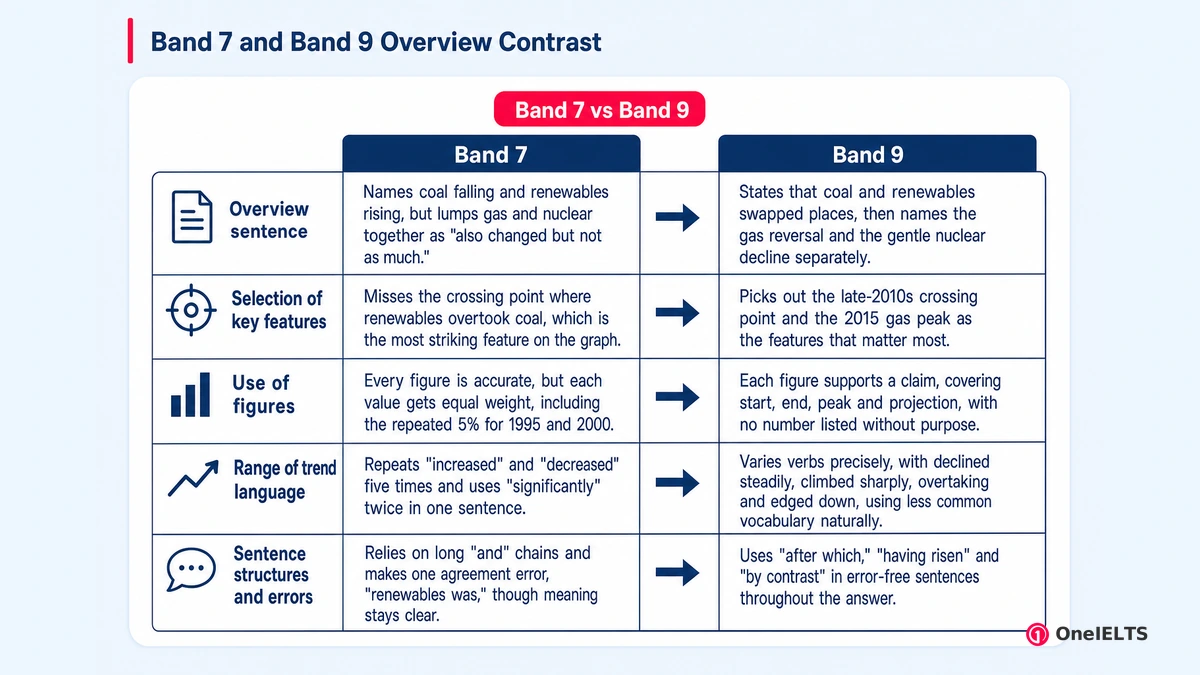
A band 7 answer has a clear overview and accurate figures but selects key features less precisely, repeats trend words and makes occasional errors. A band 9 answer selects only the features that matter, varies its language naturally and is almost error-free. Here is the overview and first body paragraph of the sample above, rewritten at band 7 on the same graph.
Overall, coal decreased significantly and renewable energy increased significantly over the period, and it is expected that renewables will be the biggest source in 2035. Gas and nuclear also changed but not as much.
In 1995, coal was the biggest source with 52%, but it decreased steadily to 15% in 2025 and it is expected to decrease to 6% in 2035. On the other hand, renewables was only 5% in 1995 and 2000, then it increased dramatically and reached 37% in 2025. In 2035 renewables will increase to 55%.
Set side by side, the two versions differ on five features, each tied to the descriptor wording that separates them.
| Feature | Band 7 version | Band 9 version | Descriptor line that separates them |
|---|---|---|---|
| Overview sentence | Names coal falling and renewables rising, but lumps gas and nuclear together as “also changed but not as much.” | States that coal and renewables swapped places, then names the gas reversal and the gentle nuclear decline separately. | Band 7: “main trends or differences are identified.” Band 9: “All the requirements of the task are fully and appropriately satisfied.” |
| Selection of key features | Misses the crossing point where renewables overtook coal, which is the most striking feature on the graph. | Picks out the late-2010s crossing point and the 2015 gas peak as the features that matter most. | Band 7: “could be more fully or more appropriately illustrated.” Band 8: “Key features are skilfully selected.” |
| Use of figures | Every figure is accurate, but each value gets equal weight, including the repeated 5% for 1995 and 2000. | Each figure supports a claim, covering start, end, peak and projection, with no number listed without purpose. | Band 7: “there may be a few omissions or lapses.” Band 9: “There may be extremely rare lapses in content.” |
| Range of trend language | Repeats “increased” and “decreased” five times and uses “significantly” twice in one sentence. | Varies verbs precisely, with declined steadily, climbed sharply, overtaking and edged down, using less common vocabulary naturally. | Band 7: “some ability to use less common and/or idiomatic items.” Band 9: “Full flexibility and precise use are evident.” |
| Sentence structures and errors | Relies on long “and” chains and makes one agreement error, “renewables was,” though meaning stays clear. | Uses “after which,” “having risen” and “by contrast” in error-free sentences throughout the answer. | Band 7: “error-free sentences are frequent.” Band 9: “Minor errors are extremely rare.” |
Three edits move a band 7 answer toward band 8 or 9. First, name the single most striking feature, here the crossing point, in the overview. Second, cut any figure that doesn’t support a trend you’ve stated. Third, replace every repeated “increased” or “decreased” with a verb that also shows speed, such as climbed sharply or edged down.
What Are the Most Common IELTS Line Graph Mistakes?
Most marks go on describing every data point, giving trends without figures, leaving out the overview, using the wrong tense for the time span, and overstating small changes. Seven mistakes cover most of the damage, each paired with its fix.
- Describing every data point instead of selecting key features: listing all nine years for each line buries the trend; report start, peak, end and any crossing point instead.
- Giving trends without supporting figures: “coal fell sharply” needs evidence, so write “coal fell sharply from 52% in 1995 to 15% in 2025.”
- Writing body detail but no overview: a missing overview caps Task Achievement, so add two sentences on the overall trends straight after the introduction.
- Using the wrong tense for past or projected years: “coal fell to 6% in 2035” is the wrong tense; write “coal is forecast to fall to 6% by 2035.”
- Exaggerating small changes: “soared” for a 2% rise misreports the graph; match the degree adverb to the size, as in “rose slightly.”
- Describing lines one at a time in legend order: walking through the lines in legend order hides comparisons; group lines that rise together or cross each other.
- Adding opinions or reasons the graph does not show: a personal opinion such as “because people care about climate” adds nothing; report only what the graph shows.
The page on common IELTS Writing mistakes covers the errors that cost marks in both tasks.
How Can You Practise IELTS Line Graphs Before the Test?
Practice one theme at a time under the 20-minute limit, write the overview first, then compare your answer against a model and the band descriptors. A five-step routine builds that habit over two to three weeks.
- Write two-sentence overviews first: draft overviews for five or six graphs before attempting any full answer, so trend-spotting becomes automatic.
- Time full answers at 20 minutes: timed practice shows whether planning or checking eats your writing minutes.
- Rotate themes such as energy, population and transport: switching themes each session makes your trend language transfer across topics.
- Compare each answer against a model answer: compare overview and figures with the model and descriptors, then rewrite the weakest paragraph.
- Get feedback on Task Achievement first: fix the overview and key features before polishing vocabulary, since content limits bands most.
In our marking of practice scripts, the overview is the paragraph that moves most when a learner rewrites it after feedback. OneIELTS IELTS Writing practice gives you Task 1 graphs to work through, and full timed tests are available as a free mock test.
How Is a Line Graph Answer Scored in IELTS Writing?
The examiner gives the line graph answer a band from 0 to 9 on each of the four Task 1 criteria: Task Achievement, Coherence and Cohesion, Lexical Resource, and Grammatical Range and Accuracy. Those four bands are combined into the Task 1 score. Each criterion band carries equal weight, and Task Achievement is the one that rewards the overview and key-feature selection covered above. The Task 1 score is then combined with Task 2 to give the Writing band.
How Much Does a Line Graph Answer Count Toward Your Writing Band?
The line graph is Task 1, and Task 2 counts twice as much as Task 1 in the final Writing band, so the line graph carries about one third of it. Ielts.org states that “Task 2 contributes twice as much as Task 1 to the Writing score.” That Task 2 weighting makes time management simple: stop at about 20 minutes. IELTS doesn’t publish the exact rounding of the Writing component. The IELTS Writing band descriptors explain each criterion.
What Does a Line Graph Answer Need to Reach 8.5 in IELTS Writing?
The answers that support an 8.5 in Writing select every key feature in a clear overview, back each trend with accurate figures and use precise trend language with almost no errors. That goes alongside a Task 2 essay at band 8 or above.
A band 8.5 needs both tasks at a high level, since the weighting stops a strong line graph from carrying a weaker essay. Two habits cap strong writers below 8: an overview that lists trends without naming the most significant of the key features, and repeated trend verbs. See IELTS band 8.
Is an Overall Score of 7.25 Rounded to 7.5 in IELTS?
Yes, an overall average ending in .25 is rounded up to the next half band, so 7.25 becomes 7.5, and an average ending in .75 is rounded up to the next whole band. This rounding rule comes from ielts.org. Your Writing band, which includes the line graph, is one of four component scores averaged into that overall band. Gaining a half band in Writing can lift your IELTS band score.
Does a Line Graph Answer Lose Marks Under 150 Words?
Yes, an answer under 150 words is penalized under Task Achievement, because it is unlikely to cover the key features the task asks for. The 150-word minimum is part of the task, and an underlength penalty follows when it isn’t met.
Writing far more earns nothing extra and costs Task 2 time, so aim for 170 to 190 words. IELTS doesn’t publish how figures such as 25% count toward your word count, so see how to count words in IELTS Writing.
Written by Jamil Ahmed, reviewed 7 October 2026.
Last verified: 7 October 2026
Practice for the Real IELTS Exam
Apply what you’ve learned with free, exam-style practice:
- Take a free IELTS mock test — all four skills, real exam timing, AI band scoring
- Sit a Writing section mock — Task 1 and Task 2 in one timed hour with a band estimate
- Practice by question type — self-paced Writing sets with model answers