



A table prompt gives you raw numbers in rows and columns, and asks for a 150-word report that selects and compares the main features. It punishes you twice, and almost every guide warns about only one.
Report too many numbers and you lose marks for getting lost in detail. Leave a category out and you lose marks for missing information. There is a floor as well as a figure ceiling, and nobody says where the line is.
A bar chart draws a shape and does some of the selecting for you. A table has drawn nothing, so every figure looks equally important until you decide otherwise. That makes collective reporting and selection under a limit the whole skill.
This guide covers the question kinds, reading the table, how many figures, grouping, the overview, the vocabulary, the grammar, a band 9 answer, the common errors and practice.
What Is an IELTS Task 1 Table Question?
An IELTS Task 1 table question is an Academic Task 1 prompt presenting data as a grid of rows and columns. It asks you to summarise the information by selecting and reporting the main features, making comparisons where relevant.
One property sets it apart from the other six visual types. A table is the only Task 1 visual with no drawn shape, so nothing has been pre-selected for you.
IELTS Buddy states the consequence plainly. Tables are not as visually clear as graphs or pie charts because they are just numbers, so the data has to be read carefully before it can be organised into groups and paragraphs.
A table prompt is not asking for reasons, and it is not asking for every figure either. Selecting main features is the instruction, and the grid is what makes it hard.
The 150-word minimum, the 20 minutes and the four criteria belong to the IELTS Writing Task 1 hub.
Which Kinds of Table Question Can You Get?
Two kinds, plus one pairing: a table showing one point in time, a table tracking the same categories across several years, and a table that arrives beside another visual. A single time point turns the report into a comparison. Multiple time points turn it into a description of change.
- One time point: the story is comparison between categories, the tense is fixed by the single date, and the grouping falls out by size rather than direction.
- Several time points: the story is change, so each category is compared with itself across the columns before it is compared with its neighbours in the same year.
- Paired with another visual: the 150 words cover both, so the table gets roughly half the report and cannot be exhausted.
One point decides the grouping and the sources only imply it. With several time columns, comparing every category against every other category in every year is the fastest way to produce a list. Reading across a row before reading down a column is what stops that happening.
A paired visual halves the budget on both sides, which makes the figure ceiling below tighter rather than looser.
How Do You Read an IELTS Task 1 Table?
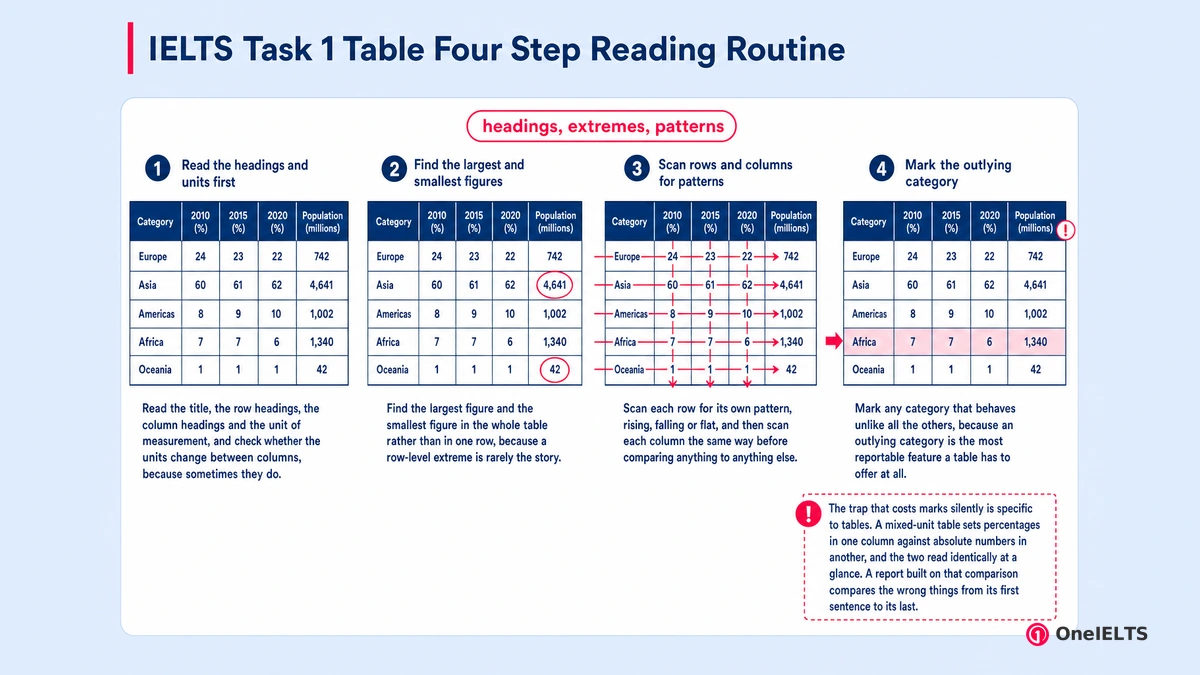
Read the headings and units first, find the extremes second, and hunt the row that behaves unlike the rest third. IELTS Jacky gives the instruction the other guides assume: do not look at the numbers in detail at this stage.
Four steps take about three minutes.
- Read the title, the row headings, the column headings and the unit of measurement, and check whether the units change between columns, because sometimes they do.
- Find the largest figure and the smallest figure in the whole table rather than in one row, because a row-level extreme is rarely the story.
- Scan each row for its own pattern, rising, falling or flat, and then scan each column the same way before comparing anything to anything else.
- Mark any category that behaves unlike all the others, because an outlying category is the most reportable feature a table has to offer at all.
The trap that costs marks silently is specific to tables. A mixed-unit table sets percentages in one column against absolute numbers in another, and the two read identically at a glance. A report built on that comparison compares the wrong things from its first sentence to its last.
How Many Figures Should You Report in an IELTS Task 1 Table?
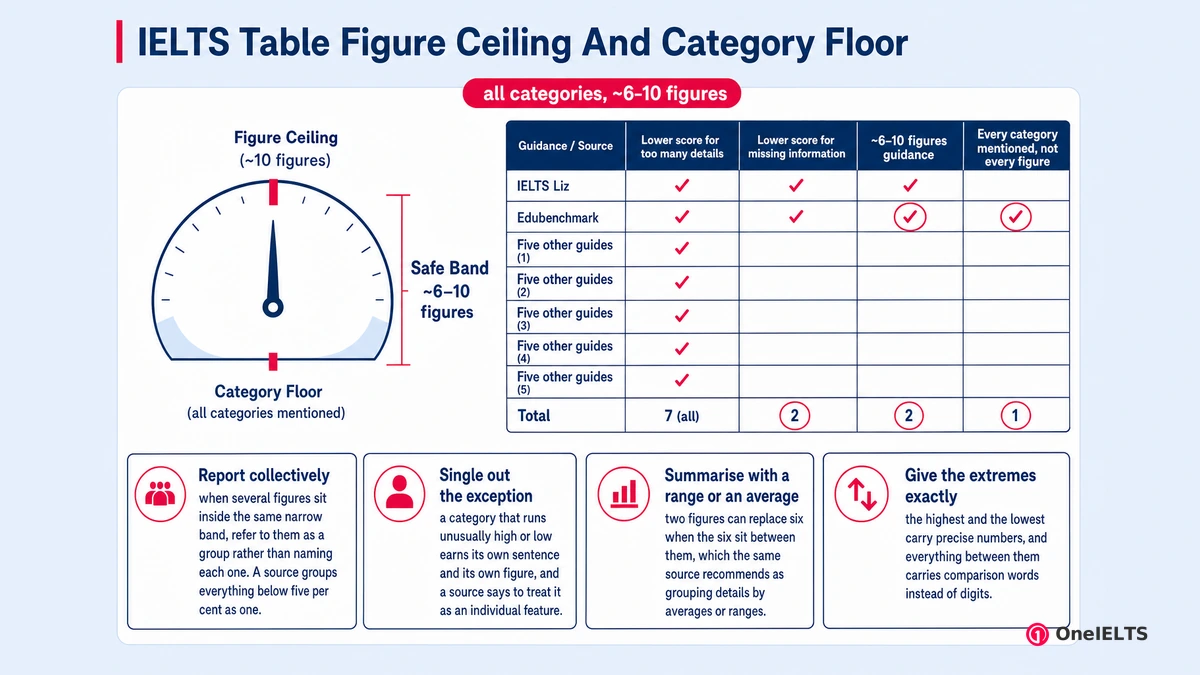
Every category gets mentioned, but not every figure. Roughly six to ten numbers carry a 150-word table report, and that count is guidance drawn from the word budget rather than a published rule.
Both halves of the risk sit on one page in the whole capture, stated in the same breath. IELTS Liz writes that you get a lower score if you give too many small details, and that you get a lower score if you miss out information. Five other guides publish only the first warning. A reader who follows those five under-reports and loses marks for it.
The rule that resolves it is every category mentioned, not every figure reported. Edubenchmark states it directly: mention each category in the table but do not describe all the data for each category. If four countries appear, write something about all four but not every figure attached to each one.
Four mechanics let you cover everything without listing everything.
- Report collectively: when several figures sit inside the same narrow band, refer to them as a group rather than naming each one. A source groups everything below five per cent as one.
- Single out the exception: a category that runs unusually high or low earns its own sentence and its own figure, and a source says to treat it as an individual feature.
- Summarise with a range or an average: two figures can replace six when the six sit between them, which the same source recommends as grouping details by averages or ranges.
- Give the extremes exactly and the middle approximately: the highest and the lowest carry precise numbers, and everything between them carries comparison words instead of digits.
Collective reporting and singling out an exception are the two that do most of the work. A range or average replaces six figures with two and costs one clause. Nobody publishes a band-by-band figure count, and inventing one would be worse than the problem it solved.
How Should You Group the Rows into Body Paragraphs?
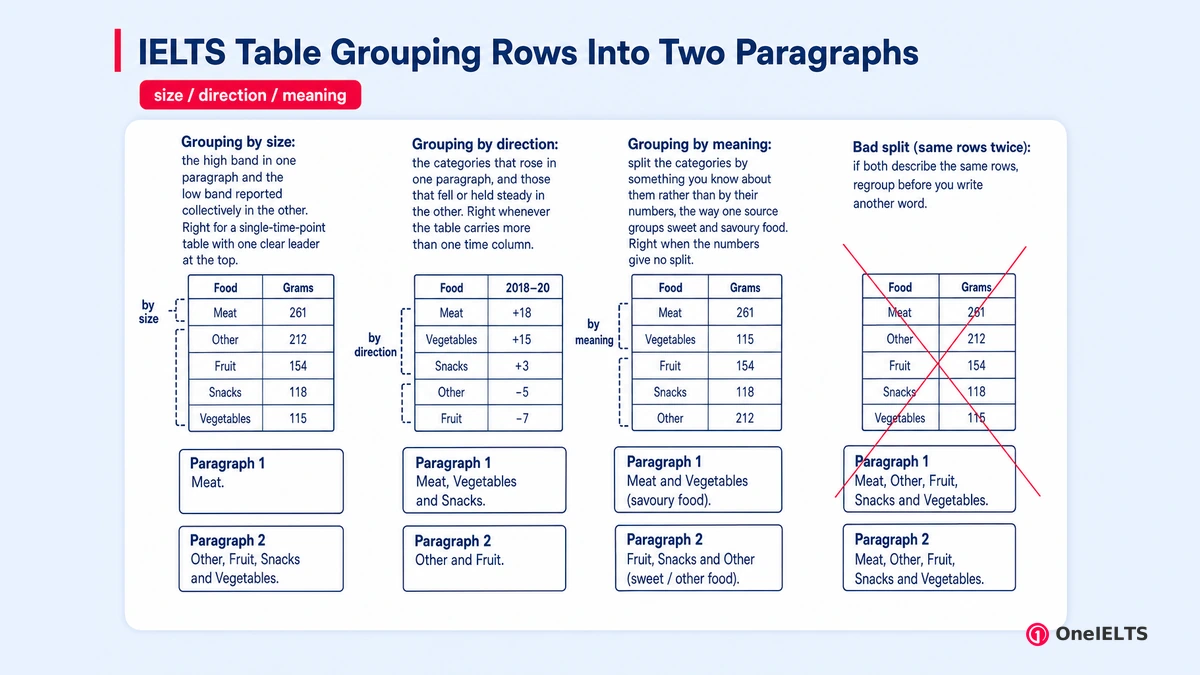
Two groups that each carry one sentence of the overview, and on a table the grouping usually has to be invented, because the data suggests nothing on its own.
That is the difference from a bar chart. A bar chart’s shape proposes a split. A table’s grid does not, so the writer supplies the logic and the examiner sees whether it holds.
- Grouping by size: the high band in one paragraph and the low band reported collectively in the other. Right for a single-time-point table with one clear leader at the top.
- Grouping by direction: the categories that rose in one paragraph, and those that fell or held steady in the other. Right whenever the table carries more than one time column.
- Grouping by meaning: split the categories by something you know about them rather than by their numbers, the way one source groups sweet and savoury food. Right when the numbers give no split.
Grouping by meaning is what separates a band 7 from a band 6 on this visual type, and it has a limit in the same breath. The split has to be a defensible split from the categories printed in the table, not from outside knowledge the examiner cannot see.
The check on a bad paragraph split needs ten seconds. Read the first sentence of each body paragraph, and if both describe the same rows, regroup before you write another word.
How Do You Write the Overview for an IELTS Table?
Two sentences after the introduction, naming the highest category and the lowest category and the general pattern, with no figures at all. The overview paragraph is the one that decides whether the report reads as selection or as transcription.
IELTS Liz puts the weight on it directly: the overview is the most important paragraph, and it must contain all the key features for a high score.
A table tempts writers to prove the pattern with numbers, and the same source settles that too. The function of the overview is to describe the key features, not the details, so it does not carry the numbers for the highest or the lowest.
Two things belong in it and nothing else does. Which category leads and which trails, and whether that ordering holds across every column or changes partway.
Two frames show the shape, offered as frames rather than phrases to copy.
- Single time point: X recorded the highest figure of the categories shown, while Y recorded the lowest, and the remaining categories clustered close together.
- Multiple columns: X led throughout the period while Y stayed at the bottom, although the gap between the two narrowed by the final year.
Which Vocabulary Do You Need for an IELTS Table?
Comparison language does most of the work, and the collective nouns do the rest. Four small sets cover a table report, and the second is the one that makes the figure ceiling achievable.
- Comparison language: considerably higher than, roughly double, marginally below, on a par with, the second largest, for setting one row against another.
- Collective nouns: the remaining categories, the other four countries, the lowest three, all figures under five per cent, which is what keeps the count down.
- Extreme value words: peaked at, the highest figure, the lowest recorded, topped the table, came bottom, for the two values that always earn a number.
- Change verbs for multi-column tables: rose, declined, held steady, more than doubled, fell back, because several columns turn a table into a story of movement.
Without the collective set a writer either names every figure or silently drops categories, and both cost marks. That is why the second set matters more here than on any drawn visual.
Heading repetition is the other trap. A table’s row headings are its only nouns, so they repeat in every sentence unless the collective nouns are planned before the writing starts. The full word set has its own page and the section below hands off to it.
Which Grammar Do You Need for an IELTS Task 1 Table?
Comparative and superlative structures plus one correctly chosen tense, and nothing more elaborate than that. IELTS Jacky gives the reassurance the other guides leave implicit: no complicated grammatical structures are required, just the appropriate words and correct verb tenses.
- Comparative structures: higher than, nearly twice as many as, slightly below. Spending in Germany was nearly twice as high as in Italy is the clause that carries most of the report.
- Superlative forms: the highest, the lowest, the second most common. Japan recorded the highest figure in every year shown is needed once per group and rarely more.
- Tense: past simple for a completed period, present for undated data, a modal or future form for a projected column. Numbers are expected to rise covers the last case.
One tense case belongs to tables and the other visuals rarely raise it. A table whose columns run from past years into a projected column needs both tenses inside one report, and the switch happens at the column rather than at the paragraph break.
The most frequent structural error is a comparative with no comparison object, as in sales were higher with nothing after it. The shared tense rules belong to the IELTS Task 1 tenses page.
What Does a Band 9 Table Answer Look Like?
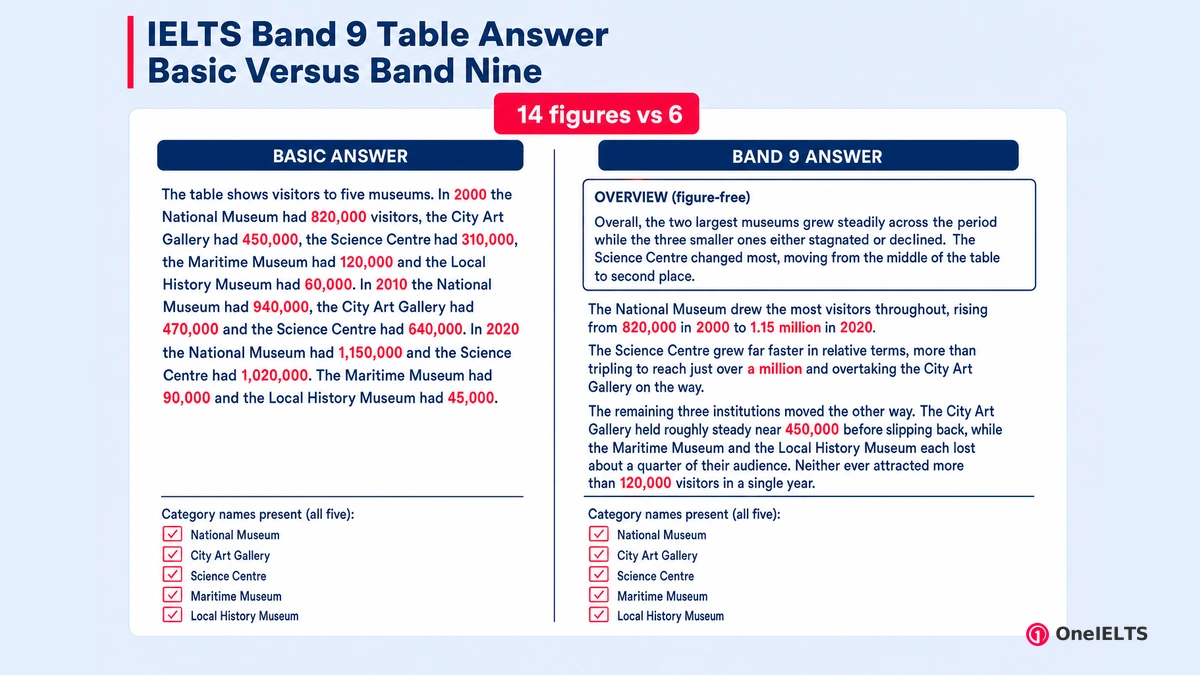
About 170 words in four paragraphs, mentioning every category, quoting fewer than a dozen figures, and comparing rather than listing. One ranking page prints a basic answer and a band 9 answer for the same table. That pairing shows the ceiling better than any rule statement, so this section does the same on a OneIELTS table.
| Museum | 2000 | 2010 | 2020 |
|---|---|---|---|
| National Museum | 820 | 940 | 1,150 |
| City Art Gallery | 450 | 470 | 430 |
| Science Centre | 310 | 640 | 1,020 |
| Maritime Museum | 120 | 105 | 90 |
| Local History Museum | 60 | 55 | 45 |
Visitor numbers in thousands. Here is the basic version first, so the contrast has something to sit against.
The table shows visitors to five museums. In 2000 the National Museum had 820,000 visitors, the City Art Gallery had 450,000, the Science Centre had 310,000, the Maritime Museum had 120,000 and the Local History Museum had 60,000. In 2010 the National Museum had 940,000, the City Art Gallery had 470,000 and the Science Centre had 640,000. In 2020 the National Museum had 1,150,000 and the Science Centre had 1,020,000. The Maritime Museum had 90,000 and the Local History Museum had 45,000.
Every figure is accurate and the answer still fails, because it carries no overview, no comparison and no selection. Now the band 9 version of the same table.
The table compares visitor numbers, in thousands, at five museums in one city in 2000, 2010 and 2020.
Overall, the two largest museums grew steadily across the period while the three smaller ones either stagnated or declined. The Science Centre changed most, moving from the middle of the table to second place.
The National Museum drew the most visitors throughout, rising from 820,000 in 2000 to 1.15 million in 2020. The Science Centre grew far faster in relative terms, more than tripling to reach just over a million and overtaking the City Art Gallery on the way.
The remaining three institutions moved the other way. The City Art Gallery held roughly steady near 450,000 before slipping back, while the Maritime Museum and the Local History Museum each lost about a quarter of their audience. Neither ever attracted more than 120,000 visitors in a single year.
The per-paragraph commentary sets each part against what earns the mark.
| Paragraph | What it does | Why it earns the mark |
|---|---|---|
| Introduction | Paraphrases the prompt, naming the five museums as a group, the three years and the unit | Task Achievement opens on whether the report identifies what the table is actually showing |
| Overview | Splits the five into growers and decliners and names the biggest mover, carrying no figures | The overview is where a table report proves it selected rather than transcribed |
| Body 1 | Evidences the growth half with two categories and four figures, including one relative comparison | Comparison rather than listing is what the task instruction asks for on every visual |
| Body 2 | Evidences the decline half, reporting the two smallest museums collectively in one sentence | Collective reporting keeps category coverage complete while the figure count stays low |
Count them out loud, because that is the whole point of the section. The band 9 answer uses six figures against the basic version’s fourteen, and it still names all five museums. The Maritime Museum and the Local History Museum share a single sentence and a single figure between them, which is category coverage without a figure each.
The worked answer runs to about 170 words, comfortably over the minimum and well inside twelve minutes of writing. Whether you can hit that basic versus band 9 gap under exam conditions is a separate question, and a timed IELTS Writing mock answers it.
What Common Errors Should You Avoid in a Table Report?
Six errors recur, and the second is the one almost nobody warns you about. The others cost marks through the criteria; this one costs marks for something you did to stay safe.
- Figure listing, row by row: the single most common table failure, because the report becomes a transcription and Task Achievement caps whatever the grammar does.
- A dropped category: the opposite error, and the one only a single competing guide warns about. Every category must appear even when its figure does not.
- Overview figures: numbers that belong in the body get buried in the paragraph whose job is the pattern, and the pattern goes missing with them.
- Mixed units, compared as though they matched: percentages in one column and totals in another read identically at a glance and produce a false comparison.
- Excessive comparison, everything against everything: with several categories and several years this produces sentences that nobody, examiner included, can follow to the end.
- Explaining why a figure is high: a table contains no causes and no marks are available for supplying one, whatever the topic invites you to think.
Only one of the six breaks a rule of the task itself, and that is the invented cause, because Task 1 asks for no explanation anywhere. The other five cost marks through the criteria instead.
Item 2 deserves the emphasis. One page in a six-page capture warns that leaving information out costs a score, and five warn only about the opposite. So candidates cut a category to keep the count down, and lose marks for the cut.
How Do You Practise IELTS Task 1 Table Questions?
Practise the selection rather than the writing. Count your figures on every attempt and check that no category went missing, because those two numbers are the whole skill on this visual type.
- Take one table and, before writing anything, list the categories and mark which of them will get a figure of their own.
- Write the overview only, on five different tables, until two figure-free sentences come easily and quickly.
- Write one full report untimed, then write two more in twenty minutes each without stopping.
- After each one, count the figures you used and tick off every category to check that none was dropped.
- Compare with a model answer for its selection, never to reuse its sentences or its phrasing.
Step four is the unusual instruction and it earns its place. The category checklist and the figure count make both halves of the rule visible at the same moment, and no amount of reading a model will do that for you.
Step two is the overview drill, and it is cheap: five overviews cost less time than one full report. Step five is a selection review rather than a language one, which is a different way to read a model answer than most candidates use.
Table practice needs tables, and IELTS Writing Task 1 table practice is filtered to this one visual type. Practising needs a free OneIELTS account.
How Do You Structure a Table Chart Report?
The frame is the same for every Task 1 visual: introduction, overview, two body paragraphs, at least 150 words in about 20 minutes. Only what goes inside the body paragraphs changes with the visual.
That shared four-paragraph frame and the 150-word minimum govern pie charts, maps and letters in the same way. What moves is the visual-specific language, which on a table means comparison and collective nouns. The Task 1 hub settles the marking criteria, the word rules and the twenty-minute plan, and the IELTS Writing Task 1 page covers all three.
Which Vocabulary Do You Need for Task 1 Charts?
Comparison language, degree adverbs and the words for change carry across every Task 1 visual. Only the collective nouns that a table needs for its unnamed figures are close to table-specific.
The shared comparison language a table teaches is the same set a bar chart needs, which makes the table a good visual to learn first. A degree adverb and a change verb travel just as far. The IELTS Task 1 vocabulary page holds the full lists.
Can a Table Appear with a Bar Chart in One Question?
Yes. A Task 1 prompt can pair a table with a bar chart or a pie chart, and the 150 words then have to cover both visuals.
What changes is the budget. The table gets roughly half the report on a combined prompt, so the figure ceiling drops and the collective mechanics matter more rather than less. The failure with paired visuals is exhausting the table and then having sixty words left for the chart. That halved word budget and the split coverage it forces are what the IELTS Writing Task 1 multiple charts page covers.
Where Can You Find IELTS Task 1 Table Questions?
Table prompts are the least published of the seven visual types, because the prompt banks carry far more bar charts and line graphs. The scarce thing here is not the marking, it is the tables.
Two free sources exist. The published official sample tasks carry a handful, and a niche prompt bank carries more. Neither supplies a clock, a band estimate, or any check on whether a category went missing. Type-filtered practice fixes the scarcity, and IELTS Writing Task 1 table practice opens only this visual. Practising needs a free OneIELTS account.
Written by Jamil Ahmed, reviewed 14 August 2026.
Last verified: 14 August 2026
Practice for the Real IELTS Exam
Apply what you’ve learned with free, exam-style practice:
- Take a free IELTS mock test — all four skills, real exam timing, AI band scoring
- Sit a Writing section mock — Task 1 and Task 2 in one timed hour with a band estimate
- Practise by question type — self-paced Writing sets with model answers


